Uptime and latency
HTTP checks across Production, Staging, and Development. Know which environment is down before a staging blip looks like a customer outage.
Product tools, consolidated
Telemetry, uptime, errors, deploys, incidents, and vendor status live in separate tabs today. HACHQ pulls them into a single workspace so you can see the whole product without hopping between tools.
Every product runs on a pile of tools. HACHQ consolidates the ones that matter — monitoring, telemetry, delivery, and platform health — so the signal sits in one spot.
HTTP checks across Production, Staging, and Development. Know which environment is down before a staging blip looks like a customer outage.
Sentry issues and related signals sit next to the product they belong to — not buried in another dashboard you only open after something breaks.
GitHub Actions, Netlify deploys, and the rest of your shipping path appear with the app, so “did it go out?” has one answer.
Automatic open and resolve from failed checks, plus manual declaration and outbound alerts. One shared story when something is wrong.
Twilio, Salesforce, Azure, Netlify, Algolia, and other feeds live in Services — useful the moment a dependency is having a bad day.
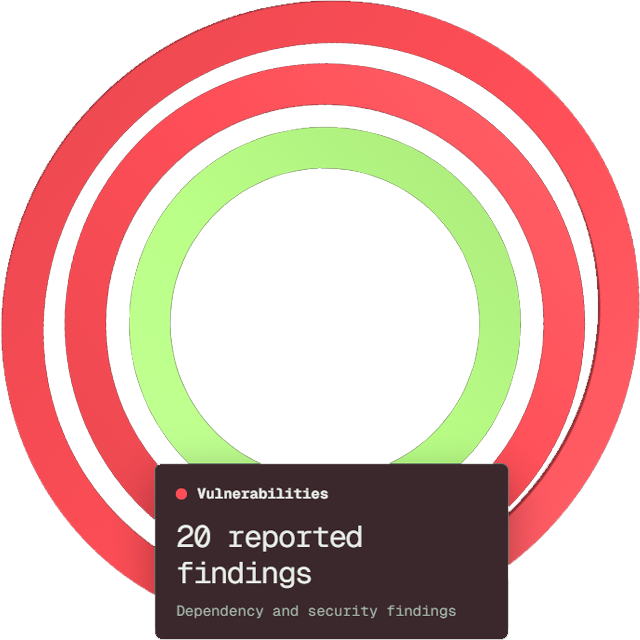
Dependency findings, Dependabot, and code scanning sit beside uptime and telemetry, so risk is part of the same picture.
Connect what you already use. Map it to each product. Operate from a single pane.
Wire up monitoring, telemetry, source control, hosting, cloud, and the platforms your product depends on.
Attach URLs, environments, and provider resources. Production drives the headline; other environments stay separate and clear.
Uptime, telemetry, incidents, deploys, dependency risk, and vendor status — consolidated where you already make product decisions.
Put uptime, deploys, incidents, and security on one screen. Tell us about your products and we will walk you through HACHQ.